

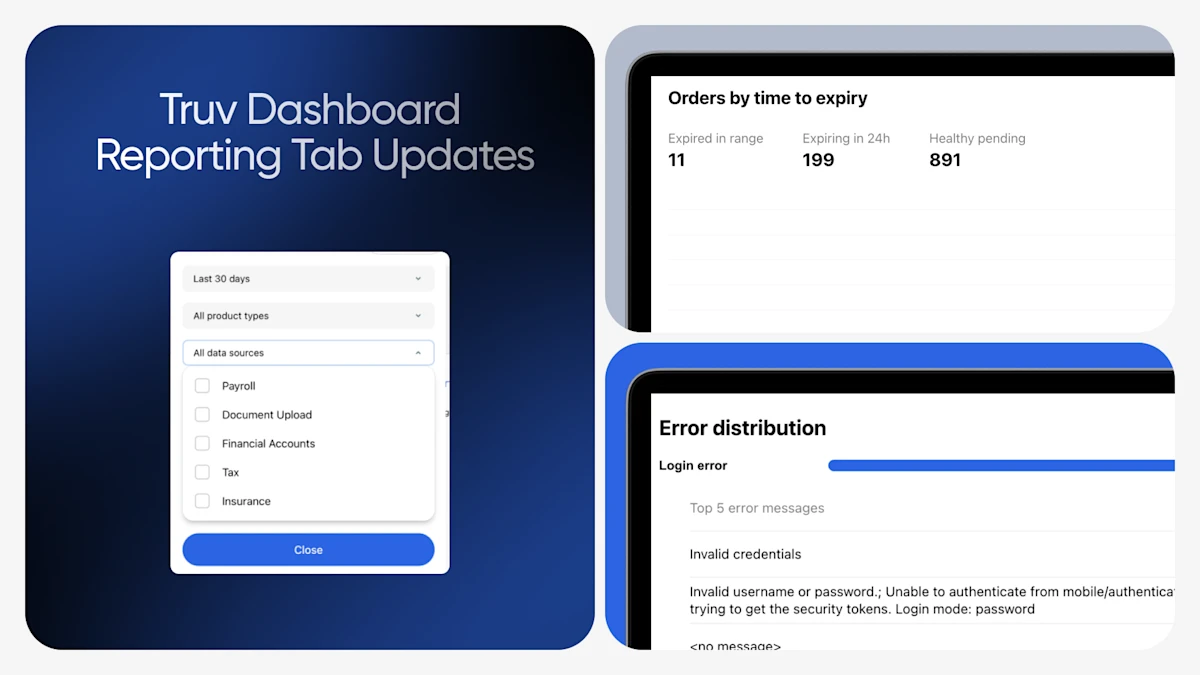
We've released three enhancements to the Reporting tab in Truv Dashboard, available now to all Truv clients: orders by time to expiry, multi-select data source filtering, and an expandable error distribution that shows the top five error messages inside every error category.
1. Orders by time to expiry: a work queue, not a metric
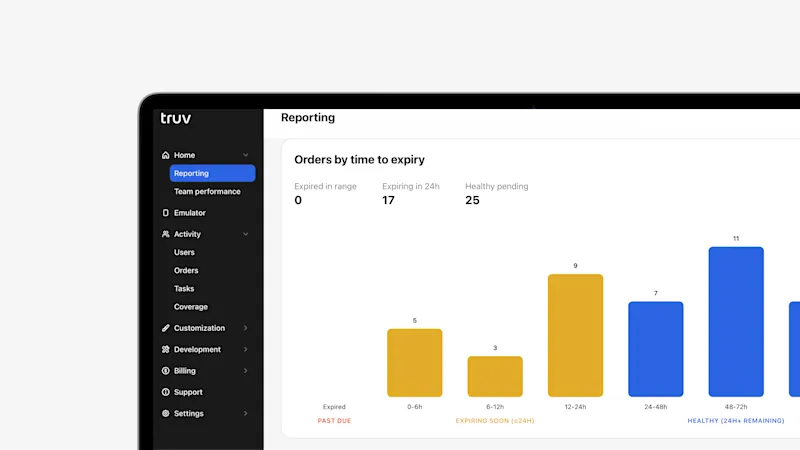
Until now, reporting told you the outcome after the expiration occurred. Now you can see exactly where your pending orders sit relative to expiry, before they lapse. Orders are grouped by remaining time, color-coded from past due through healthy.
Pending orders are grouped into three color-coded bands:
- Past due — orders that expired within your selected date range
- Expiring soon (≤24h) — broken out into 0–6h, 6–12h, and 12–24h
- Healthy (24h+ remaining) — broken out into 24–48h, 48–72h, and 72h+
Three summary figures sit above the chart: expired in range, expiring in 24h, and healthy pending.
Why it matters: an expired order is rework. The end user gets re-contacted, someone re-orders the request, and the file sits another day. Now in one view, you can see where orders are sitting, with the visibility to act on follow-ups as needed.
Additionally, orders by time to expiry filtering has been added to the Orders tab table view.
2. Filter by multiple data sources at once
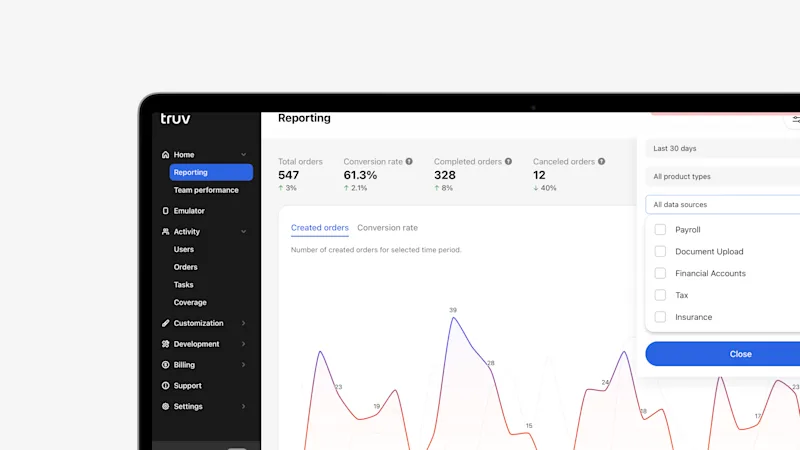
The data source filter now supports multi-selection. Check any combination of Payroll, Document Upload, Financial Accounts, Tax, and Insurance instead of just one. Every chart on the tab refreshes on demand.
Why it matters: most teams don't think in single sources. You think in workflows. For lenders, Payroll Income and Employment Verification plus Document Fallback is your income story. Financial Accounts on its own is your assets story. Pulling those views used to mean either running the report source by source and reconciling in a spreadsheet, or accepting a blended number that hides the pattern you're looking for.
The multi-selection applies across the entire tab and stacks with your existing date range and product type filters, so completion, expiry, and error views all reflect the same view at the same time.
Additionally, in the Orders tab, the multi-data source filtering feature is available to view multiple order types in one view.
3. Error distribution, down to the actual message
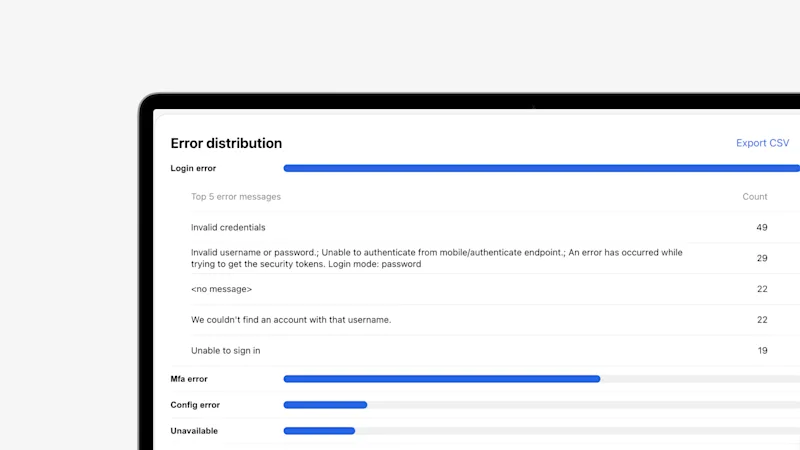
Errors are grouped into categories: Login error, MFA error, Config error, Unavailable, Unable to reset, and more. Every category now expands to show its top five error messages, each with a count and a percentage to monitor. Use Expand all to open every category at once, or Export CSV to pull the whole distribution.
Why it matters: "Login error" is a category, not a diagnosis, and the categories all recommend different actions once you open them.
- Invalid credentials is usually an end-user-side re-entry problem — better instructions and a retry can move that number.
- We couldn't find an account with that username often points somewhere else entirely, like an end user selecting the wrong employer or provider.
- A provider-side message is a conversation for your Truv team, not necessarily a change to your workflow.
The percentage-of column tells you whether a category is one dominant failure worth fixing or a long tail of unrelated one-offs. For more questions on your orders and error distributions, contact your customer success manager or technical account manager.
Putting the three together
The upgrades are designed to be used in sequence:
- Scope it. Set your date range, product type, and the data sources you actually care about.
- Triage it. Check orders by time to expiry and address the ≤24h bands first.
- Diagnose it. Open the error distribution for that same scope and find the specific messages behind the failures.
- Share it. Export CSV from any section and route the list to the team that owns the next step.
The result is a reporting view that supports a decision rather than just a summary, meaning which order to act fast on now, which failure mode to talk to Truv about fixing, and which conversations and questions you can bring to your Truv account team.
Available now
All three enhancements are live for every Truv client in Truv Dashboard → Reporting. No enablement required — sign in and open the Reporting tab to start reviewing.


